But catalysis makes time relevant to the evolution of a system, because what really matters is not which processes lead to the most stable final state but rather which processes occur fastest. The fastest process always happens the most. As a result, it is now possible that the distribution of matter in the system becomes displaced from its equilibrium distribution. So the gradient alone provides the basis for the system having kinetic energies that are higher than their equilibrium values, and the catalytic properties of a system are the basis by which its material distribution can move away from equilibrium. This is all a little abstract, but concrete examples are chemically complicated so let me just show you a picture and I promise to discuss this in greater detail next time:
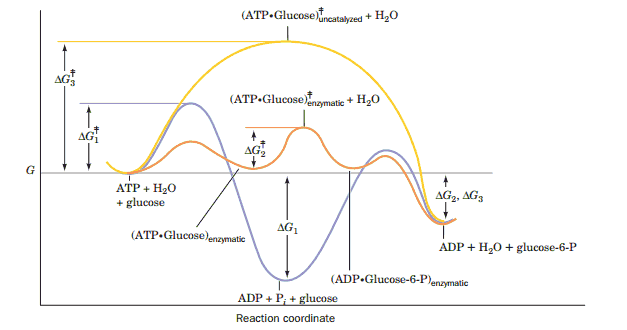
The chemical degradation of sugar (glucose) which provides energy for life processes begins when a protein catalytically attaches a phosphate ion to the sugar. Energy is on the y-axis and the progress of the reaction is on the x-axis. Each curve is tracking the energy of a different chemical process. The bottom curve, in blue, contains the lowest energy, equilibrium state of the system and corresponds to an unproductive dissociation of the phosphate ion into water. This won’t degrade the sugar and thus it won't help keep you alive, but it would be the thermodynamically favored outcome in the absence of the protein which catalyzes the reaction. The protein provides a template which lowers the activation energy required for putting the phosphate on the sugar. The activation energies are represented by the highest point on each curve, and that corresponds to the energy input required to make the process happen. You can see that the orange curve (protein catalyzed reaction) has the lowest activation energy even though the blue curve will proceed to a lower overall energy state. Lower activation energy, however, means that it's thousands or millions of times more likely that a random thermal fluctuation will be large enough to cause a reaction. This increased probability in turn leads to an accelerated reaction rate (thousands of times more likely to happen also means it occurs thousands of times more often), and practically all of the glucose ends up with a phosphate attached. The yellow curve represents the energy landscape for the uncatalyzed addition of phosphate to the sugar. You can see that its activation energy is very high, and consequently that without the protein there to catalyze the reaction this process would never occur.